Xdebug for a CLI App in Docker (and PHPStorm)
The majority of my coding are simple CLI applications. We have a nice boilerplate that helps bootstrapping the repository with all the…
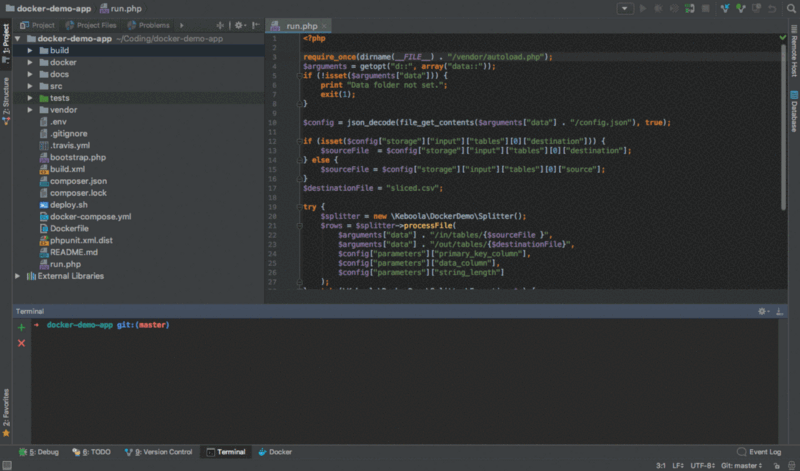
The majority of my coding are simple CLI applications. We have a nice boilerplate that helps bootstrapping the repository with all the required tools (from integration with Travis CI to static code analysis), but I was missing one piece that comes in handy when I need to debug — a debugger. Having Xdebug in your app will give you 2 major benefits:
- live code debugger (no more
var_dump) - code coverage generated when running PHPUnit tests
I went through a lot of articles touching on the subject, many of them were outdated, focused on web applications or very confusing. They simply didn't lead to a working debugger in my setup:
- OS X 10.13.1
- Docker for Mac 17.09.0-ce
- PHPStorm 2017.2.4
The application is based on a very simple Dockerfile.
FROM php:7.1-cli
WORKDIR /code
RUN apt-get update && apt-get install -y \
        git \
        unzip \
   --no-install-recommends && rm -r /var/lib/apt/lists/*
RUN curl -sS https://getcomposer.org/installer | php \
  && mv /code/composer.phar /usr/local/bin/composer
COPY . /code/
RUN composer install
CMD php /code/run.php
This code builds the image with the application, runs the tests on Travis CI, and then (if tests pass) deploys it to AWS ECR. Building Xdebug into this image would not be wise, because you don't want to have an image with Xdebug run your production app. So I have another Docker image and a separate Dockerfile just for Xdebug.
FROM php:7.1-cli
WORKDIR /code
RUN apt-get update && apt-get install -y \
        git \
        unzip \
   --no-install-recommends && rm -r /var/lib/apt/lists/*
RUN curl -sS https://getcomposer.org/installer | php \
  && mv /code/composer.phar /usr/local/bin/composer
RUN pecl install xdebug \
  && docker-php-ext-enable xdebug
COPY ./docker/xdebug/xdebug.ini /usr/local/etc/php/conf.d/xdebug.ini
COPY . /code/
RUN composer install
It is very similar to the original application image. I could have used the application image as the source (using FROM), but we tend to keep the image structure as flat as possible, so a plain copy&paste in this case. Let's see what commands were added to the original application image.
First, you need to install and enable Xdebug in the image.
RUN pecl install xdebug \
  && docker-php-ext-enable xdebug
And then copy the xdebug.ini setting file.
COPY ./docker/xdebug/xdebug.ini /usr/local/etc/php/conf.d/xdebug.iniThe ./docker/xdebug/xdebug.ini is a local relative path, and the file is stored in the repository. The the content of the file took me a while to figure out and is a key to running Xdebug in a CLI app properly.
xdebug.remote_enable=1
xdebug.remote_autostart=1
xdebug.remote_connect_back=0
xdebug.profiler_enable=0
Now you can build the image using
docker build --file Dockerfile-xdebug --tag myapp-xdebug .The image is built and ready to run. You can now run PHPUnit with the code coverage option. It may need a bit of tweaking of the phpunit.xml.dist file, but the PHPUnit CLI will tell you what to do.
docker run --rm myapp-xdebug /code/vendor/bin/phpunit --coverage-clover build/logs/clover.xmlHowever, Xdebug needs environment or ini file variables to setup the connection to your host machine for live debugging. You can bake the variables into the ./docker/xdebug/debug.ini file, but I'd recommend against it. Variables like remote_host, remote_port or serverName should not be stored in the repository and are runtime specific.
docker run --rm \
--env "XDEBUG_CONFIG=remote_host=docker.for.mac.localhost remote_port=9000" \
--env "PHP_IDE_CONFIG=serverName=myapp" \
myapp-xdebug php /code/run.php
XDEBUG_CONFIG env variable sets the remote_host and remote_port Xdebug properties. Newer versions of Docker for Mac (17.06 and newer) can conveniently use docker.for.mac.localhost to connect from the Docker container to the host. Other versions (older or other OS) will need to get the IP. remote_port needs to match your IDE settings.
PHP_IDE_CONFIG is used to pair the Xdebug instance and your project code with the IDE.
Now to your IDE. I use PHPStorm, but a different IDE will be set up in a very similar way.
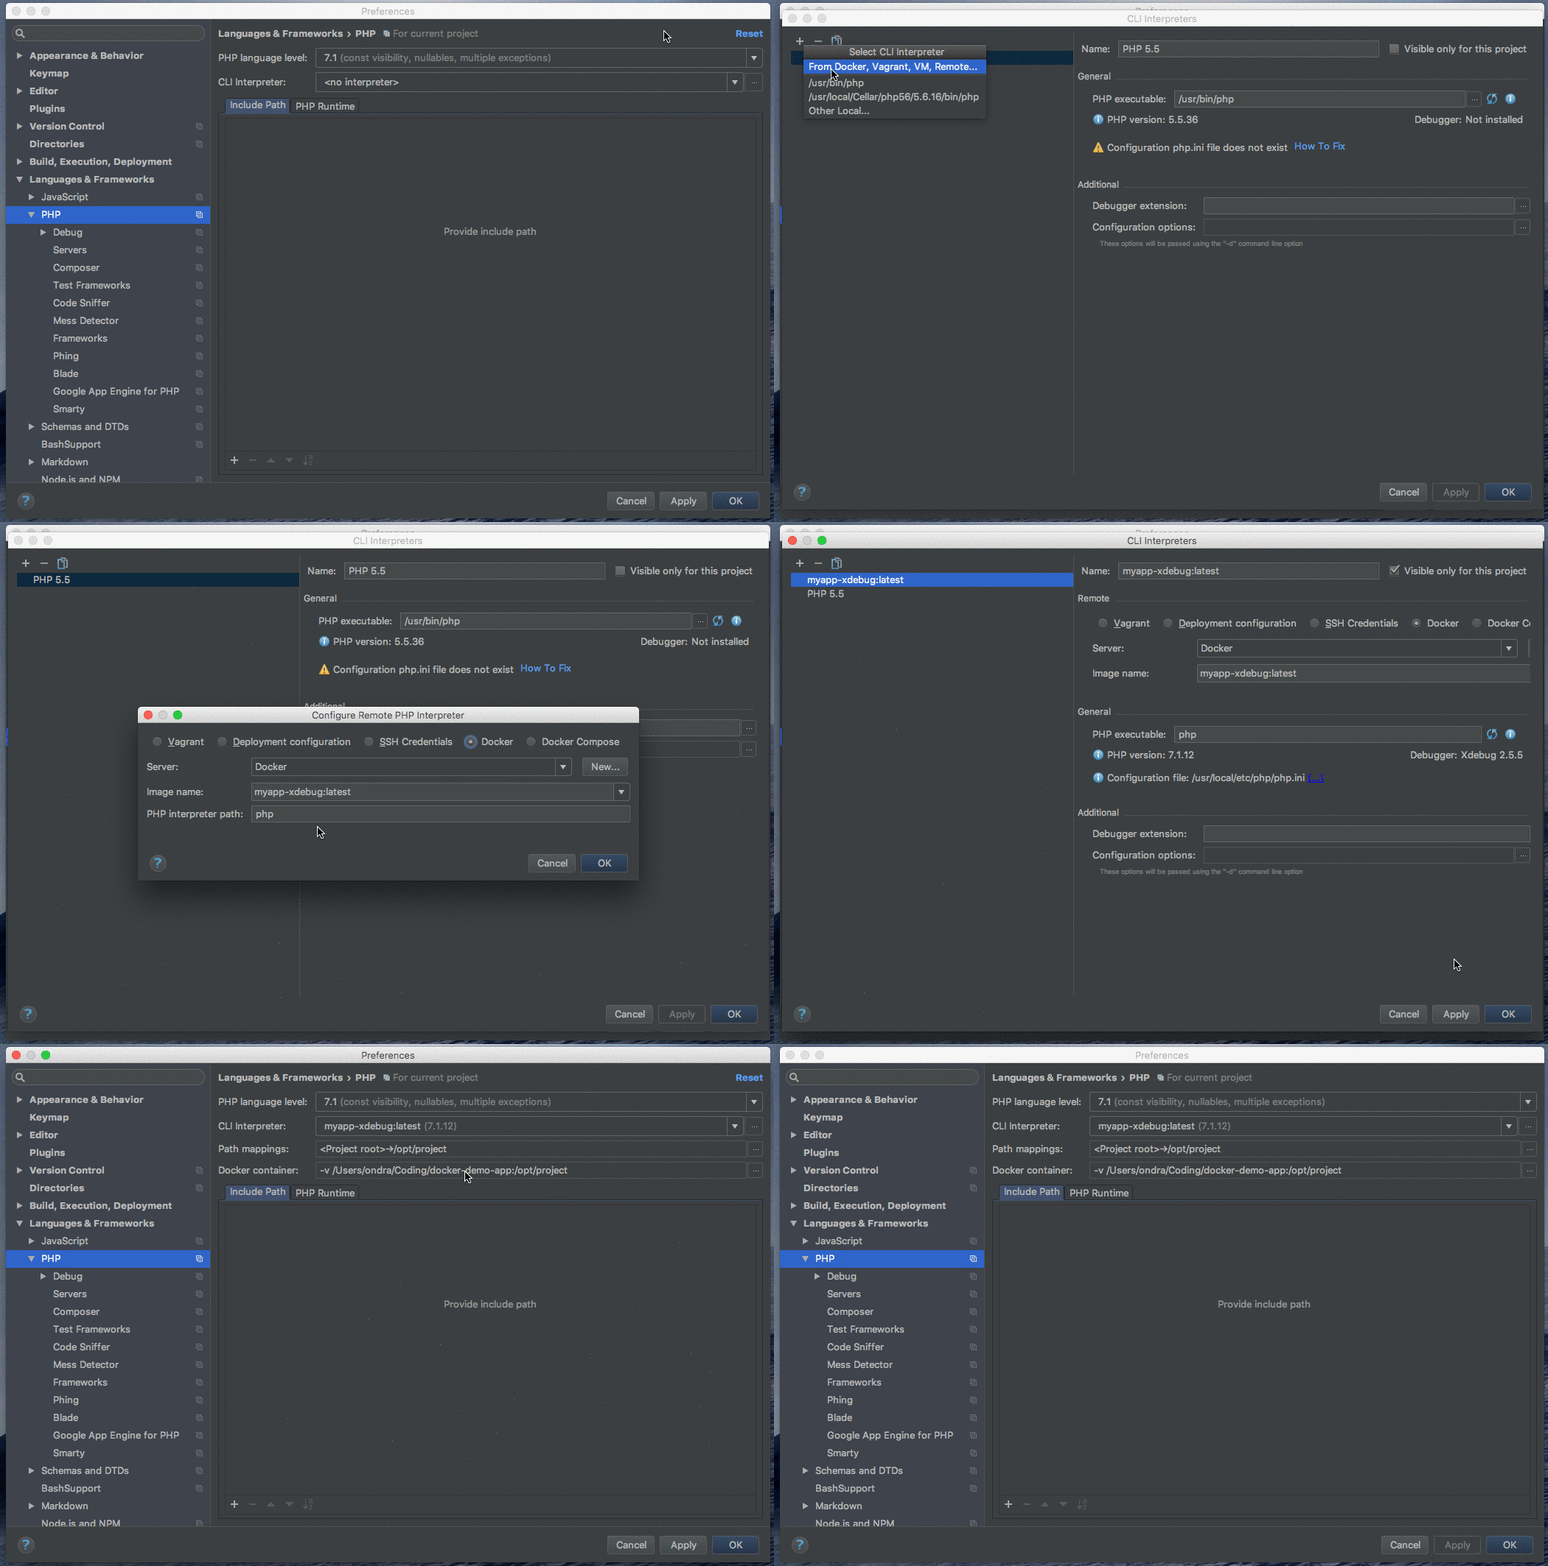
In Preferences > Languages & Frameworks > PHP, add a new CLI Interpreter. Choose the Docker option, and PHPStorm will automatically find the Xdebug image for you.
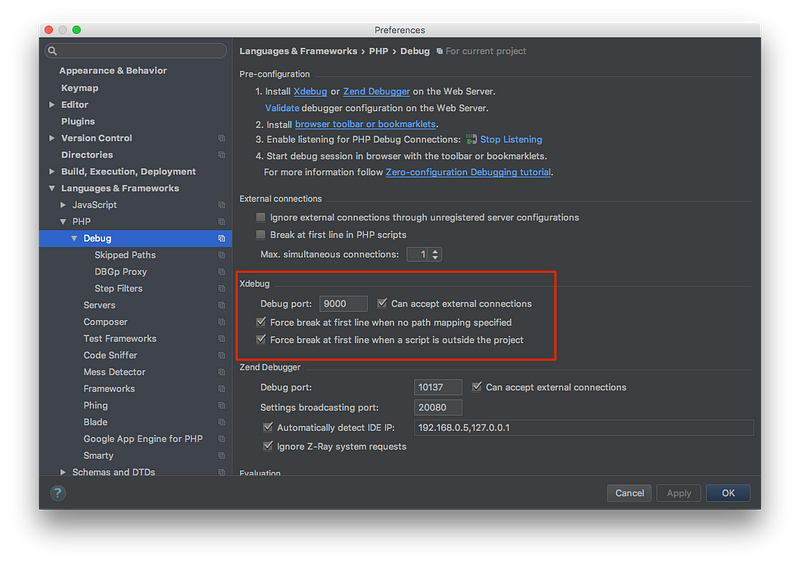
Then open Preferences > Languages & Frameworks > PHP > Debug, and set the Xdebug port to the same value as remote_port.
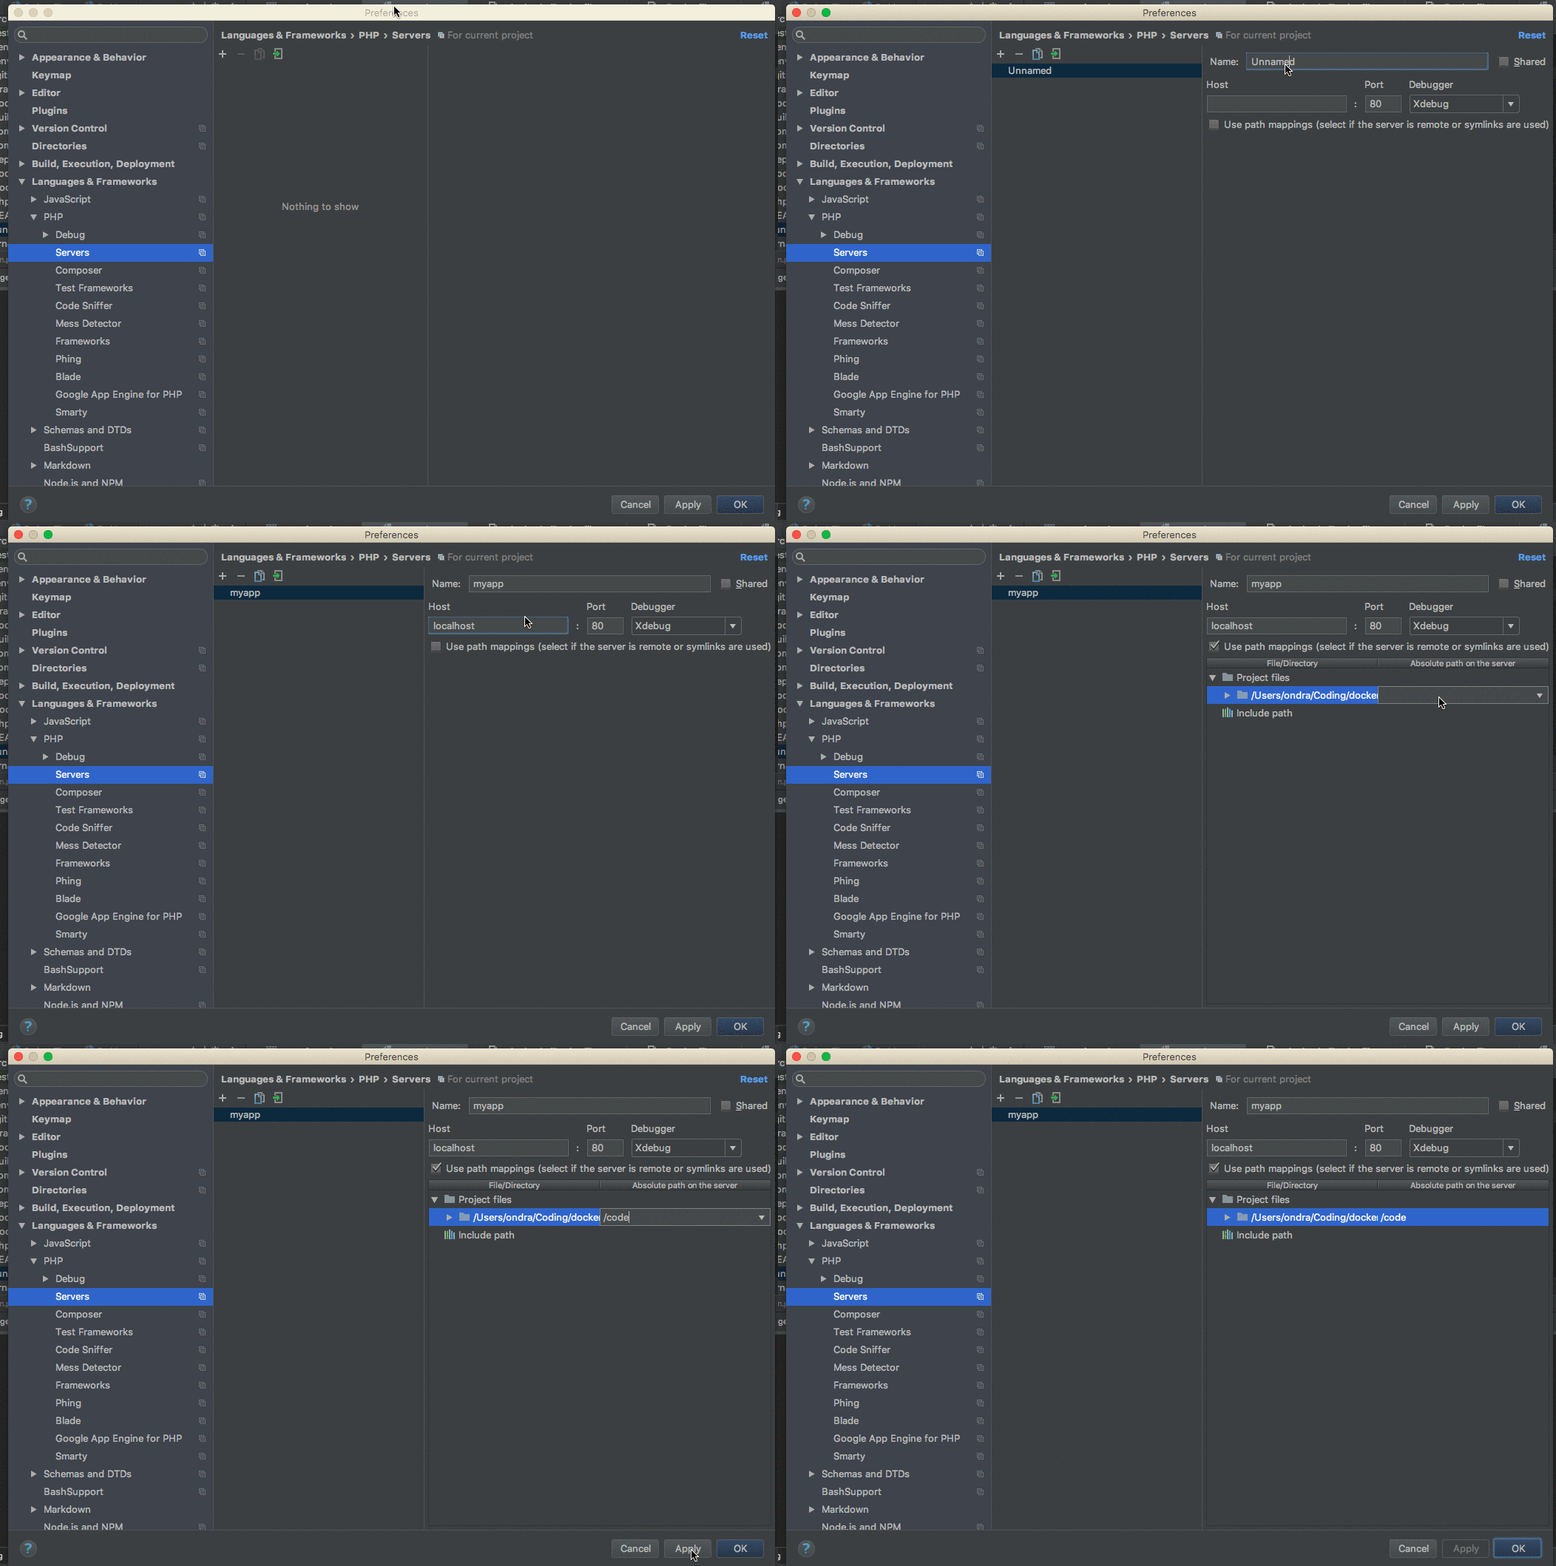
Next, you need to set up mappings so that the IDE knows what files Xdebug is talking about. Set up a new server in Preferences > Languages & Frameworks > PHP > Servers. The server name MUST match the serverName value in the docker run command. A host is required, and the localhost value fills in the blank even if it's not really relevant. Don't forget to set the mapping (my project folder is copied to /code in the Docker container when the image is built so the mapping goes from the project root to /code).
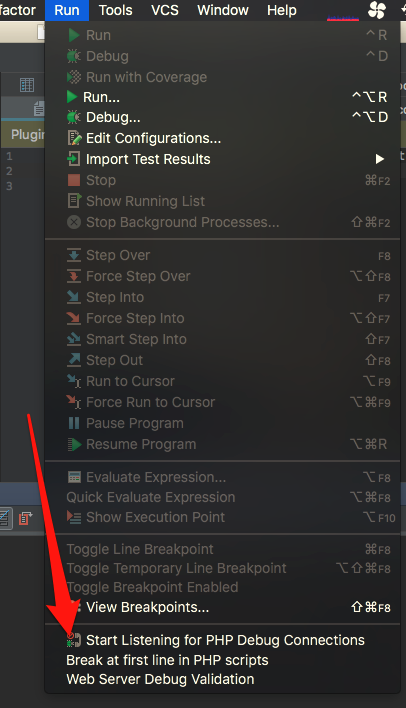
Then enable listening for Xdebug in Run > Start Listening for PHP Debug Connections.
With all this setup you can run the application and Xdebug should stop at the first break point in your code.
docker run --rm \
--env "XDEBUG_CONFIG=remote_host=docker.for.mac.localhost remote_port=9000" \
--env "PHP_IDE_CONFIG=serverName=myapp" \
myapp-xdebug php /code/run.php
There you go! I'll leave the tweaking to you, just wanted to show a simple working example. If you want to see it in a real world example, we have a demo repository that we keep up-to-date with the latest tools. I (mis)use Docker Compose to simplify the running commands as you can see in the README file.
