What’s happening in my container?
Many times during my support week in Keboola I bumped into an issue where someone needed a memory increase for his component.
Many times during my support week in Keboola I bumped into an issue where someone needed a memory increase for his component.
Sometimes it’s really easy and you just increase the memory and the component will start behaving normally. It’s completely OK to have a requirement for a higher memory consumption.
But for some cases, one memory increase is not enough, and neither are subsequent memory increases. On one side, there’s a developer saying his app is working great (works on my machine :-P), on the other side there’s our platform where his component is OOMkilled due to high memory consumption. And that’s when we need to debug.
Let’s have simple PHP application:
<?php
$items = [];
while (true) {
    $items[] = json_encode($_SERVER);
}
As you can see, this script consumes memory very fast and after a few seconds there’s no free memory.
For this article I limited container memory to 32 MB. The image bellow shows how fast memory is consumed. It takes about 2 or 3 seconds.
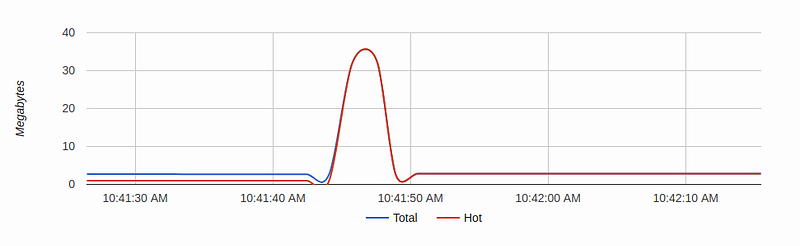
OK, but this is not a real world application example. Many times memory consumption increases in smaller amounts.
Let’s modify our script to not encode the whole $_SERVER variable and add some wait:
<?php
$items = [];
while (true) {
$items[] = json_encode([
$_SERVER['HOSTNAME'],
$_SERVER['PHP_URL'],
$_SERVER['PHP_ASC_URL'],
]);
usleep(500);
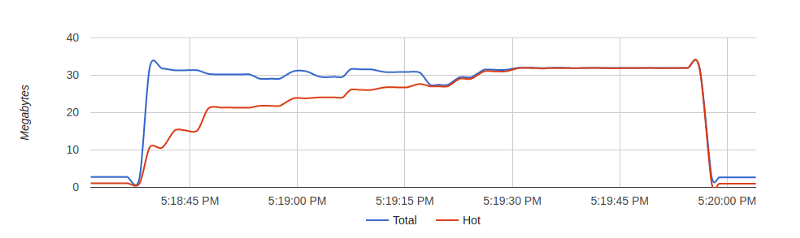
}For this case, memory isn’t consumed so fast (due to usleep for 0.5 millisecond after each assignment):
That is much better and we can see continuous increase. At the end the script is killed because it doesn’t have enough memory. This is a more realistic example of what memory consumption can look like.
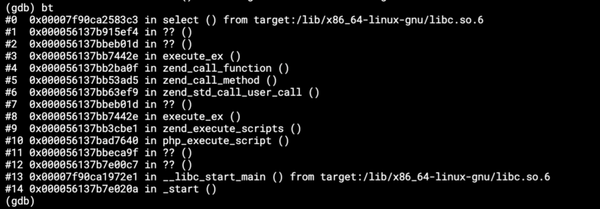
There are not many options how to debug/see what is happening in a container or to check a component’s unexpected behavior.
One is to run docker stats CONTAINER_ID command, but its output won’t say much:
CONTAINER CPU % MEM USAGE / LIMIT MEM % NET I/O BLOCK I/O PIDS
2b924ac9cc1f 3.16% 30.73MiB / 32MiB 96.03% 229kB / 0B 383GB / 33.3MB 2
Another is to run docker exec -i -t CONTAINER_ID bash command to execute bash in running container and use tools (like top, dstat, etc.) you already know to check what is happening. More advanced users will probably use strace.
An other is to run Cadvisor (by Google). It’s really straightforward and you can start it with:
docker run \
  --volume=/:/rootfs:ro \
  --volume=/var/run:/var/run:rw \
  --volume=/sys:/sys:ro \
  --volume=/var/lib/docker/:/var/lib/docker:ro \
  --volume=/dev/disk/:/dev/disk:ro \
  --publish=8080:8080 \
  --name=cadvisor \
  google/cadvisor:latest
Then open your browser at http://localhost:8080. You can check CPU, network, memory, processes, disk, etc.
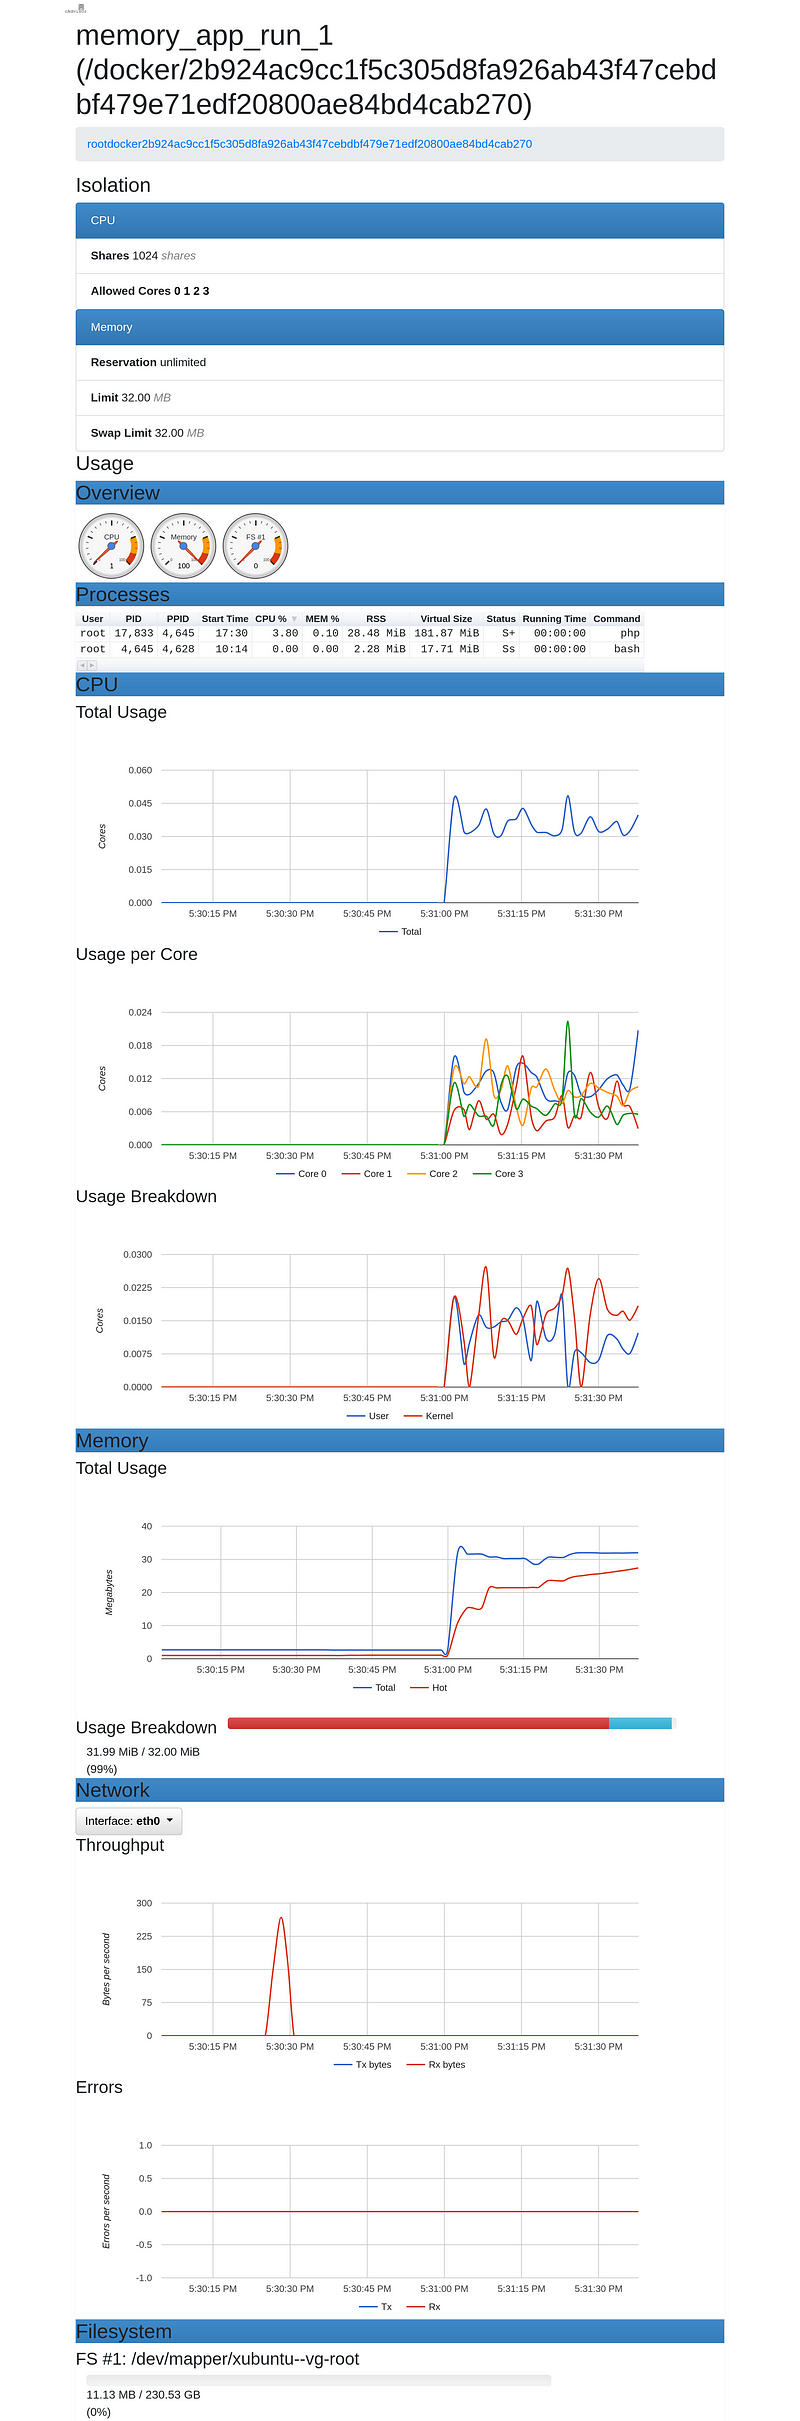
After a few seconds running the component you can see what’s wrong.
Voila! :-)